More data provides better benchmarking
This year’s publication is based on information reported in 2016 from approximately 15,000 providers. CliftonLarsonAllen’s (CLA) database now houses the financial and quality metrics of all Medicare certified SNFs in the United States. We have the capacity to draw on 800 million data points to inform the industry on trends impacting SNFs. Benchmarking demonstrates how organizations compare to median performance, and SNFs can use this data to make informed decisions.

Clarity provides a powerful strategic resource
Benchmarking is a great first step, but SNFs often need more. So we created a resource called CLA Clarity. It pairs the data that we have acquired and our industry experience to deliver insights that can help you better understand your business and focus your energy on improving key aspects of your operations that will have the largest economic impact. A discussion about how your SNF’s performance lines up with other similar organizations in your region can make the difference between interesting data and information that truly drives decisions.
CLA’s experience over many decades has provided us with a sophisticated and unique perspective on the health care industry. Our resources can help your organization understand its financial and operational challenges, so you can continue to evolve along with the industry.

Interactive data on nonprofit and proprietary SNFs
The overall assumption in this industry is that proprietary and nonprofit SNFs have different capital structures, staffing patterns, operating metric expectations, and administrative oversight, and that those differences impact metrics. In the following interactive pages, we offer insights into these issues by comparing select ratios.
Explore Your Data With CLAClick on the following operating and financial indicators to compare nonprofit and proprietary SNFs:
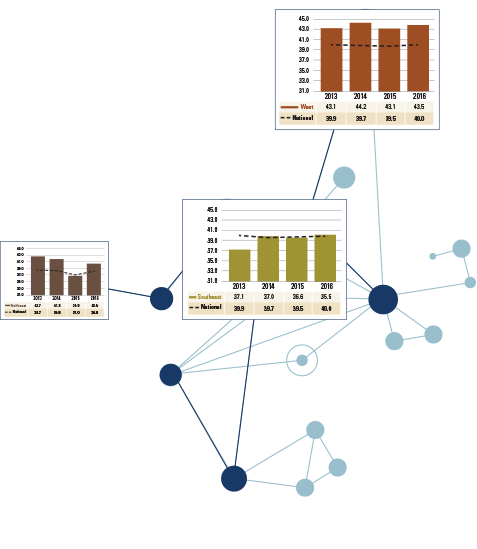
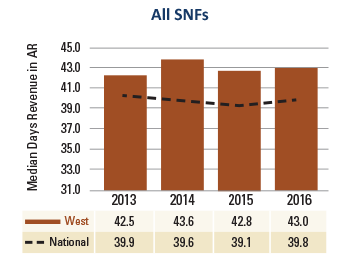
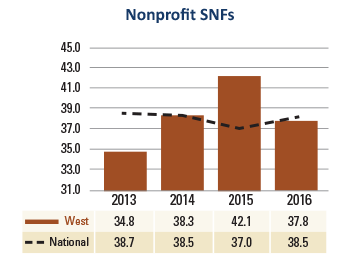
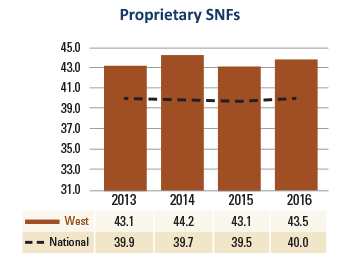
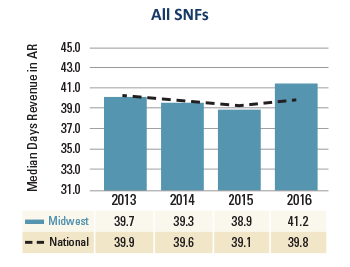
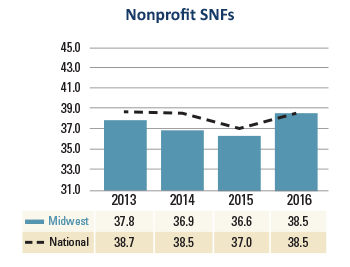
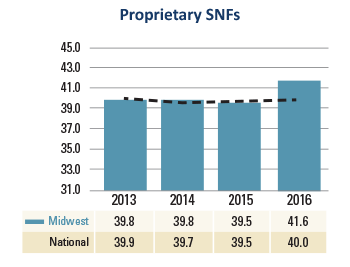
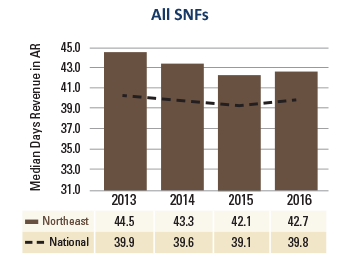
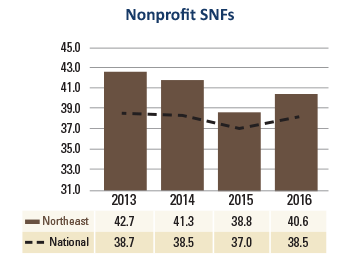
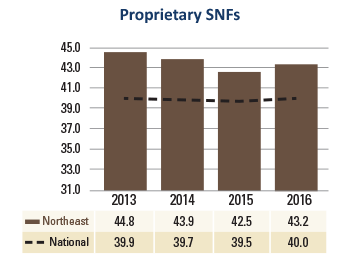
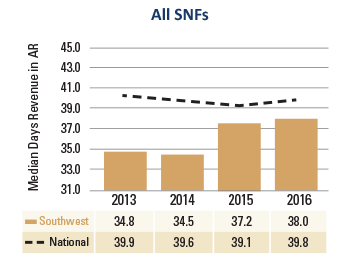
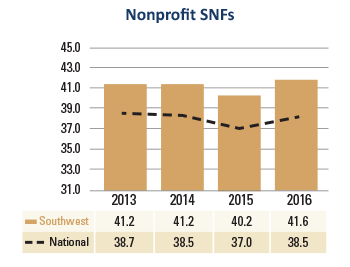
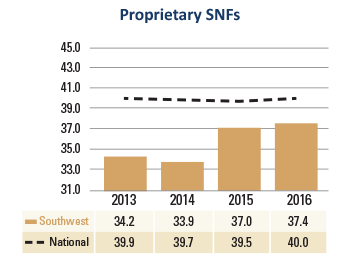
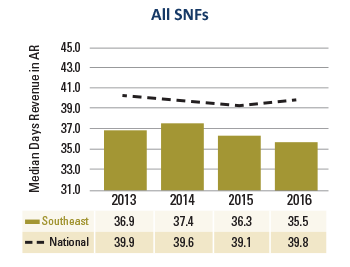
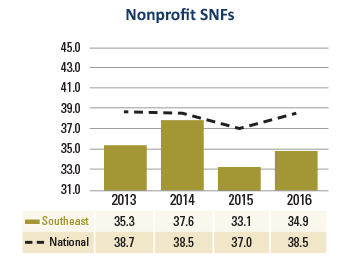
Days revenue in AR
For the first time in many years, the days revenue in accounts receivable is increasing. Based on our clients’ experiences, some organizations have navigated Medicare Advantage billing effectively, while others have struggled. The data supports this: the lowest performing quartile has seen a 1.3 day increase in this metric, while stronger performers have only experienced a 0.6 day increase.
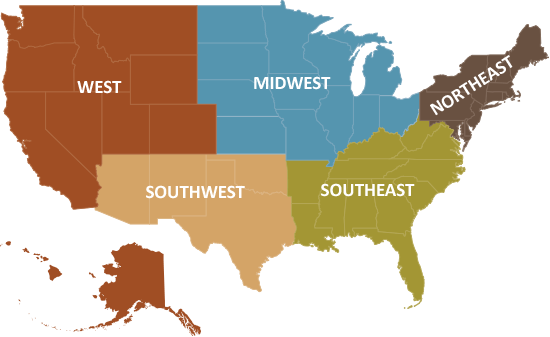
Click on a region for data specific to nonprofit and proprietary SNFs.
West Region Days Revenue in AR
Midwest Region Days Revenue in AR
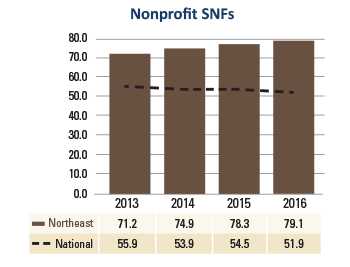
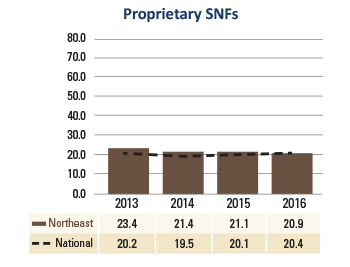
Northeast Region Days Revenue in AR
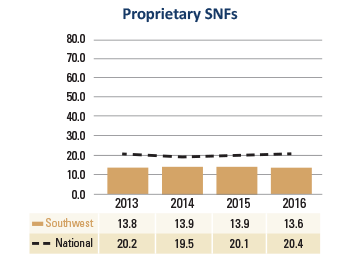
Southwest Region Days Revenue in AR
Southeast Region Days Revenue in AR
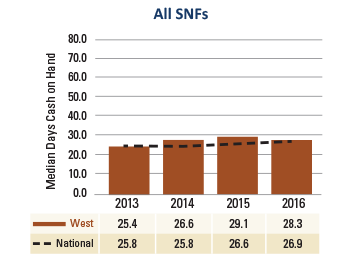
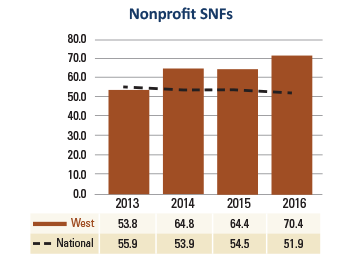
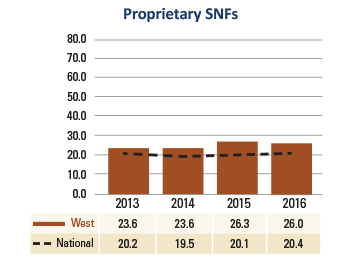
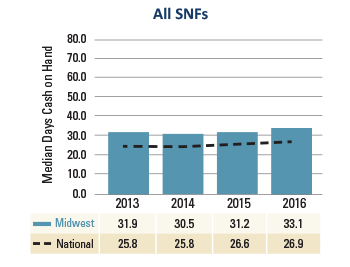
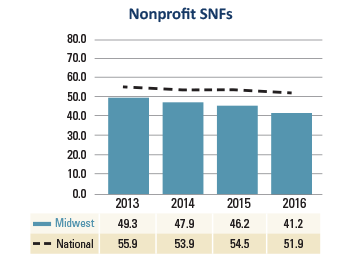
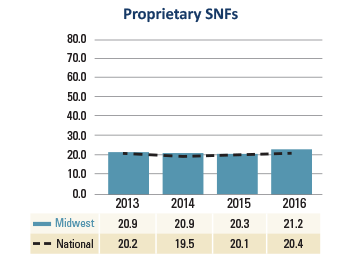
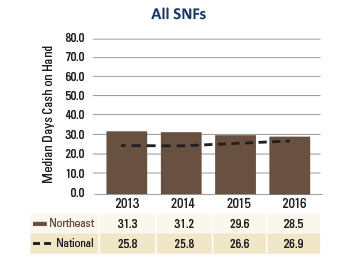
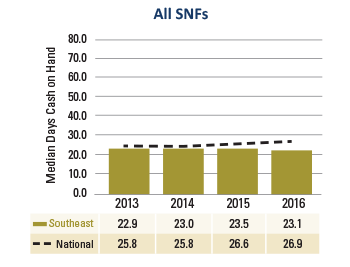
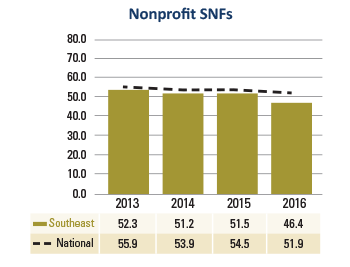
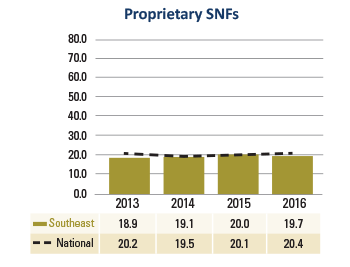
Days cash on hand
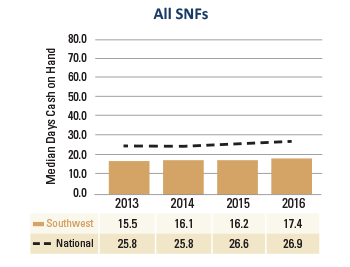
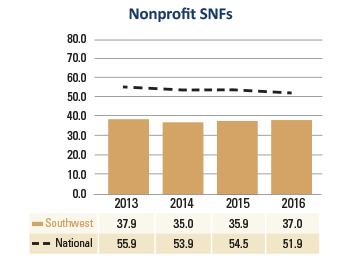
Despite reduced financial performance, median levels of days cash on hand have increased. This indicates that providers are increasingly cautious to use cash for capital purchases and owner distributions. While days cash on hand levels nationally have modestly increased, 26.9 days cash on hand continues to be much lower than targeted levels, which highlights the vulnerability of many skilled nursing providers and their month-to-month reliance on operational performance. Of particular concern is the Southwest region, where SNFs have less than 20 days of operating cash on hand. This likely correlates with their relatively low median occupancy of 71.1 percent. Also, the bottom quartile of performers have less than two weeks of cash on hand, which suggests that these organizations may have recurring concerns about making payroll.
Click on a region for data specific to nonprofit and proprietary SNFs.
West Region Days Cash on Hand
Midwest Region Days Cash on Hand
Northeast Region Days Cash on Hand
Southwest Region Days Cash on Hand
Southeast Region Days Cash on Hand
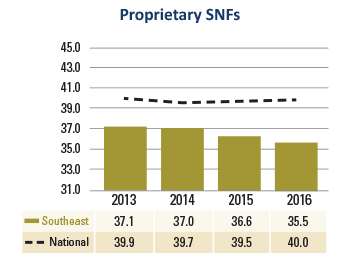
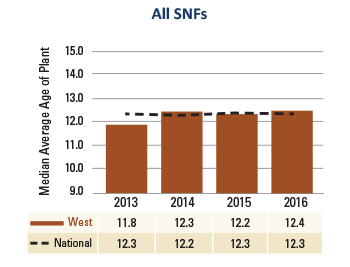
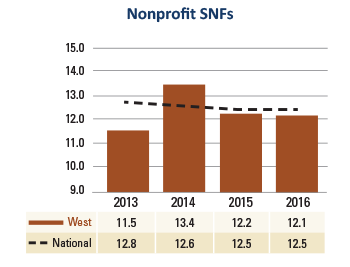
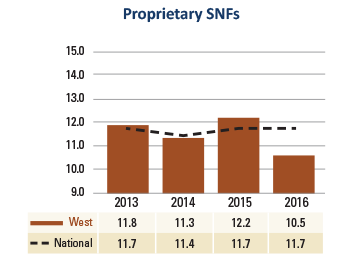
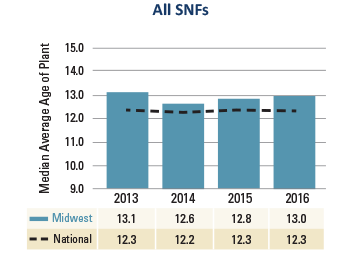
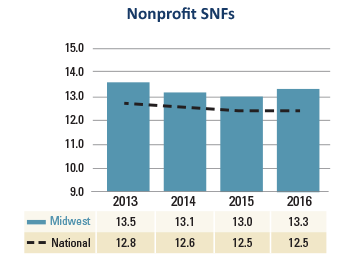
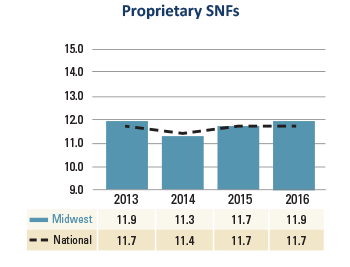
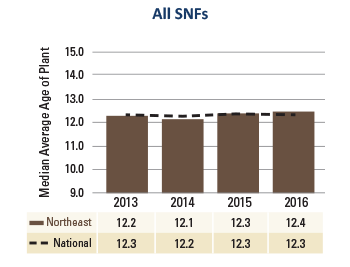
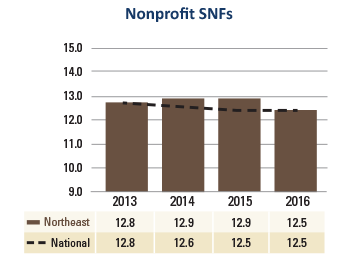
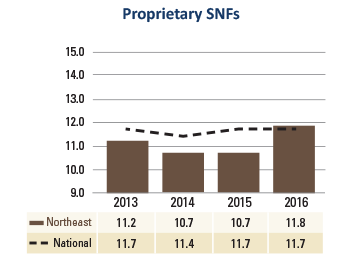
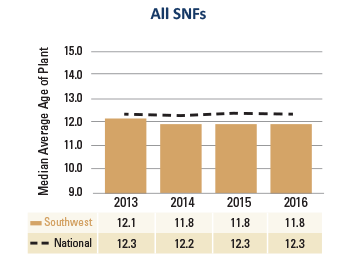
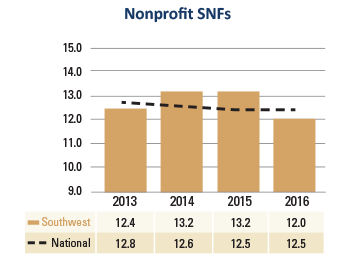
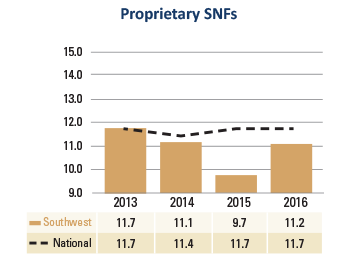
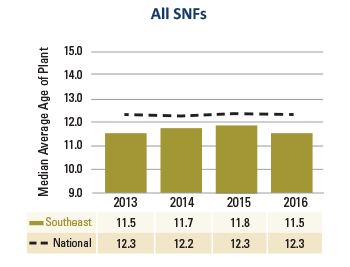
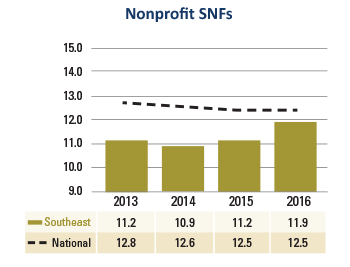
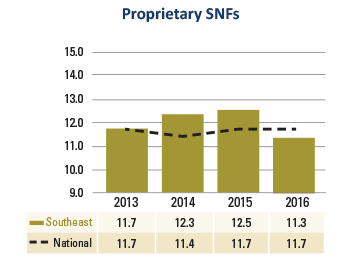
Average age of plant
This ratio should be analyzed in relation to liquidity and operating margins. This is important because organizations can, at times, improve their days cash-on-hand by deferring capital improvements. As a SNF positions itself for the future, it is critical to consider the changing expectations of the post-acute consumer. Higher margin residents tend to be rehabilitation, short-stay residents, and the median age of those individuals is lower than traditional long-stay residents. Therefore, if a SNF is going to remain relevant, it will need to cater to the expectations of a younger resident, which may require renovation.
Click on a region for data specific to nonprofit and proprietary SNFs.
West Region Average Age of Plant
Midwest Region Average Age of Plant
Northeast Region Average Age of Plant
Southwest Region Average Age of Plant
Southeast Region Average Age of Plant
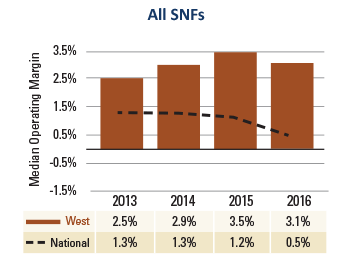
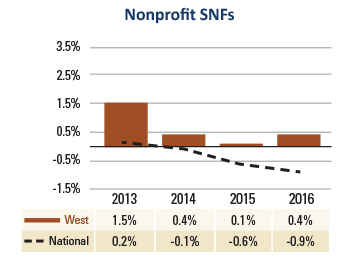
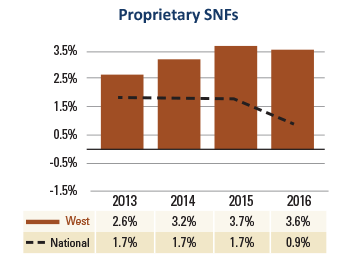
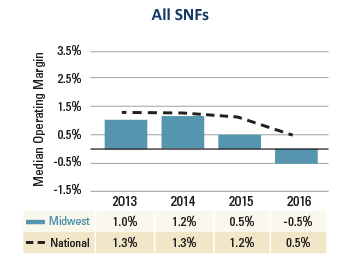
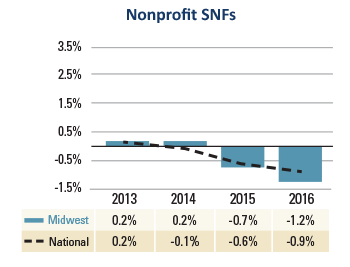
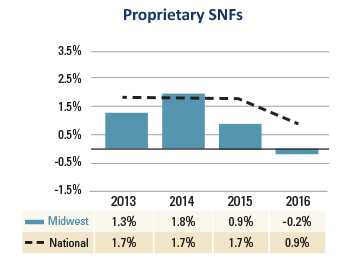
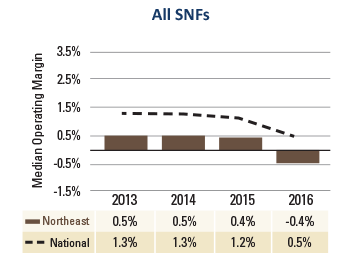
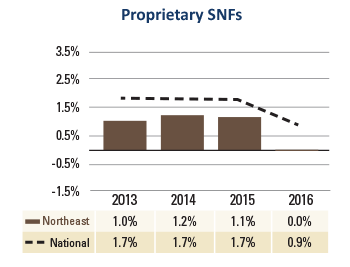
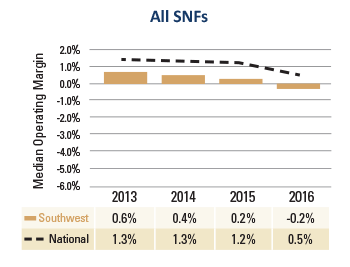
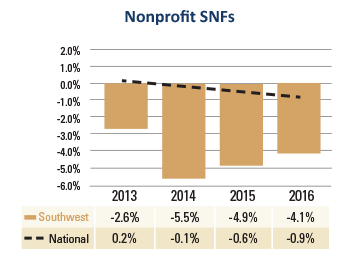
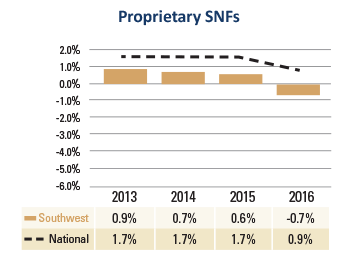
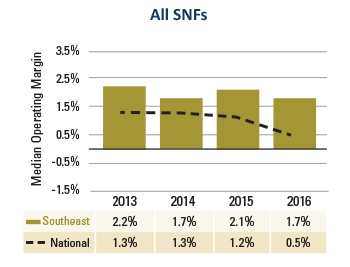
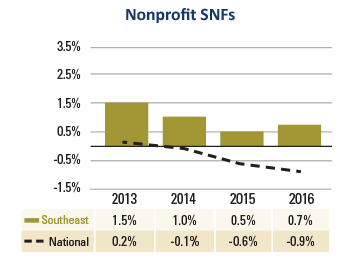
Operating margin
Lower performing SNFs are clearly struggling. As the SNF environment evolves and becomes more complicated, organizations that respond nimbly to the changes will secure referrals and promote financial success. Of particular concern is that the median operating margin is now 0.5 percent, which is less than half of the 1.2 percent median performance of just one year ago. If this trend continues, the median SNF will experience negative operating margins in 2017.
Click on a region for data specific to nonprofit and proprietary SNFs.
West Region Operating Margin
Midwest Region Operating Margin
Northeast Region Operating Margin

Southwest Region Operating Margin
Southeast Region Operating Margin
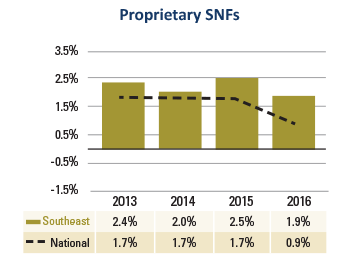
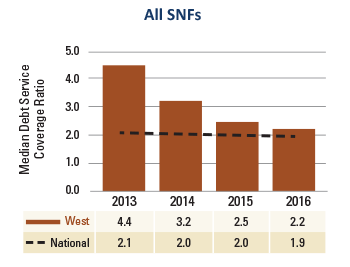
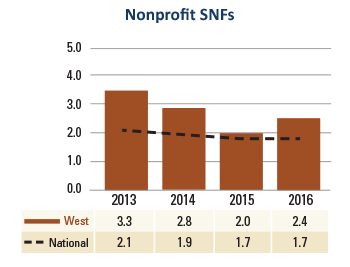
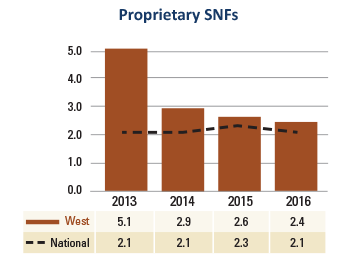
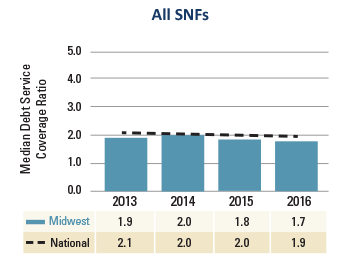
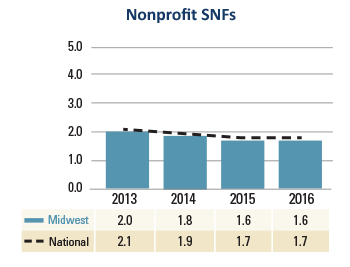
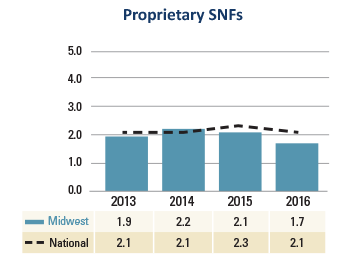
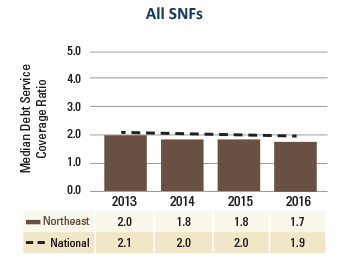
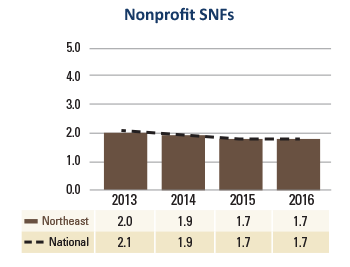
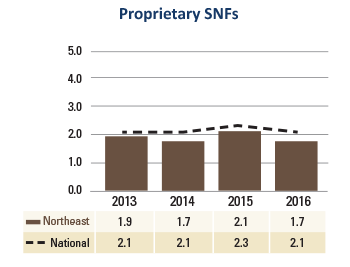
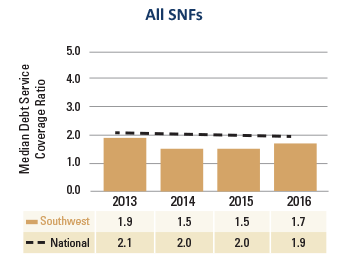
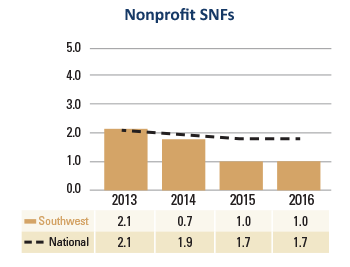
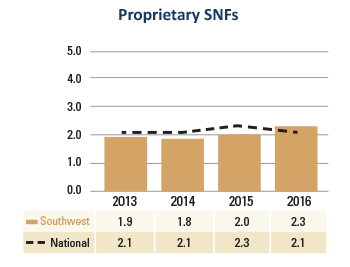
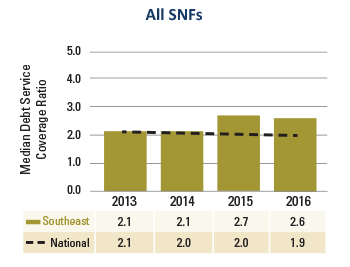
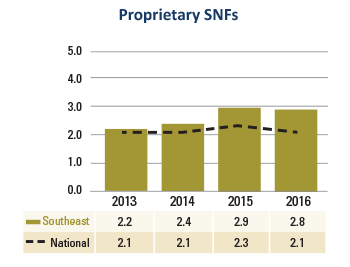
Debt service ratio
Debt service coverage is a common ratio that lenders require when negotiating funding. Nationally, this ratio decreased from 2.0 to 1.9 in 2016, indicating that the operating strain on providers is reducing operating margins necessary to fund capital requirements. Reductions in this margin highlight the need for providers to manage operating costs and service outstanding debt obligations. We believe the debt service coverage ratio will continue to be a critical ratio for organizations to measure, because low levels will contribute to an organization’s inability to access capital. Without access to capital, the facility may become less attractive than competitors, which can impact occupancy and exacerbate the financial strain.
Click on a region for data specific to nonprofit and proprietary SNFs.
West Region Debt Service Ratio
Midwest Region Debt Service Ratio
Northeast Region Debt Service Ratio
Southwest Region Debt Service Ratio
Southeast Region Debt Service Ratio

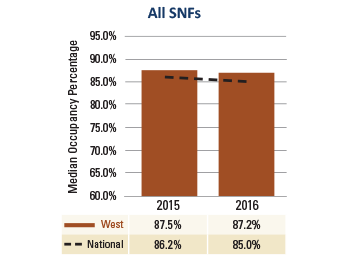
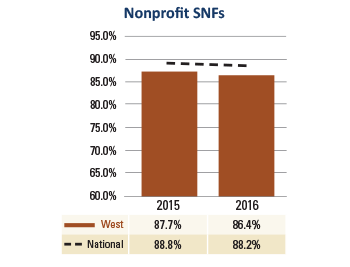
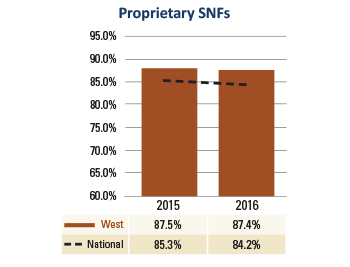
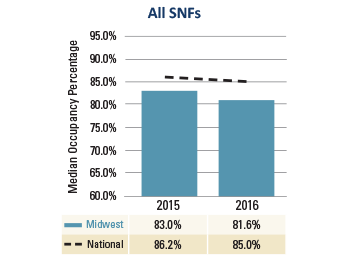
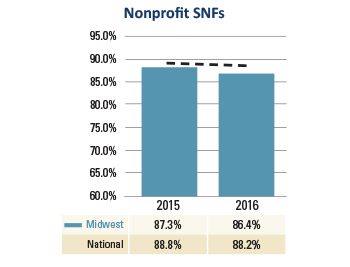
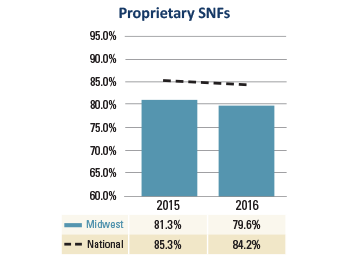
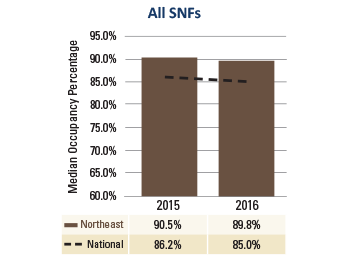
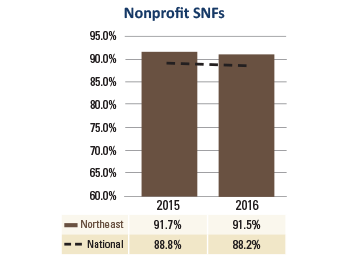
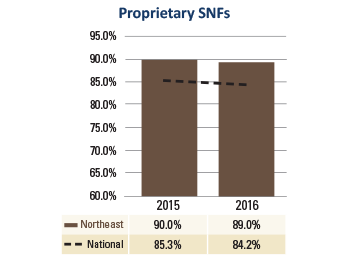
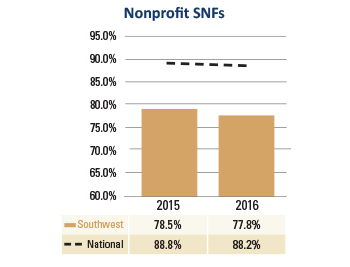
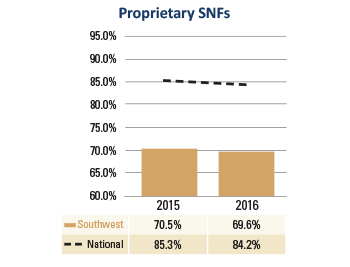
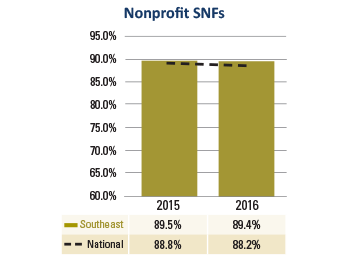
Occupancy
As health care payment transitions to value-based reimbursement, physicians and hospitals are beginning to embrace care protocols that reduce overall health care spending. Such efforts are not only reducing per capita hospitalizations, but they are also resulting in substitutions for post-acute care. These influences, along with the increased use of managed care, are reducing skilled nursing facility admissions and average length of stays. In just one year, our data indicates a 120 basis point reduction in occupancy. Reduced occupancy is a factor in all regions of the United States, and the overall occupancy median is now at 85 percent.
Click on a region for data specific to nonprofit and proprietary SNFs.
West Region Occupancy
Midwest Region Occupancy
Northeast Region Occupancy
Southwest Region Occupancy

Southeast Region Occupancy


How we can help
The health care world is fundamentally changing, and we are only at the beginning of the evolution. The regulatory and reimbursement environment will continue to strain the industry, but there are a number of opportunities for innovative SNF providers. By taking advantage of the possibilities provided by big data, SNFs can demonstrate their value to referral sources in a meaningful way. And by continuously improving outcomes, SNFs can position themselves to provide critical services in a sustainable, profitable manner.
This 32nd Edition of the Skilled Nursing Facility Cost Comparison Report can help you make strong strategic decisions. CLA’s senior living practice has evolved over many decades, and we have developed our resources in direct response to our clients’ needs. This close connection to clients allows us to offer the resources that we know can help your organization face its financial and operational challenges of the future.